In part 1 of this series, I put forward the evidence on how we are sure that CO2 levels are rising and how we know that human activities are the cause. In this article I show how it is that we know that CO2 causes the planet to warm up. I’ll start with a small rant…
Small Rant
If the Earth, like our satellite the Moon, had no (or very, very little) atmosphere, the temperature measured at its surface would be very much colder than the balmy conditions we enjoy as a species of animal that has evolved on this watery blue jewel of a planet that we call home. And let’s be sure of one thing – this mote of dust that we inhabit, with its fragile and thin atmosphere, is the only place we are ever likely to survive. Why? Because the Universe is a big place, and we will never manage to abandon this oasis of our birth to populate another rock which we may royally fuck-up in a similar manner as we have here. Rant over!
Warmer than theory
If we considered the Earth to be an ideal theoretical ‘blackbody’ then we could calculate that the radiation from the Sun would warm its surface to about 5°C. If you then allow for the fact that the Earth is quite reflective due mainly to its bright oceans, clouds and polar caps, this temperature would drop to a theoretical value of about -18°C. Something here does not add up! The actual, measured average temperature of the Earth is about +14°C, so what is it that causes the Earth to be over 30°C warmer than simple theory predicts?
The answer lies with the atmosphere – the layer of air that extends from the surface of the Earth to the edge of space. It is often said that if the Earth was the size of a bowling ball, then the atmosphere would be only as thick as a coat of varnish, and that is certainly about right, but all our weather happens in this tenuous layer of gases, and this article will explain how certain gases in the air are responsible for raising the temperature.
Isn’t this old news?
You might think that our understanding of the climate is a very recent thing, perhaps in the last few decades, but in fact we have known about the basic mechanisms that drive changes in the climate for well over a century, and the first clue came from the great French mathematician and physicist Joseph Fourier around 1824. He calculated from the size of the Earth and its distance from the Sun what the temperature should be if the only factor was the heat it receives from the Sun. As mentioned above the answer to this turns out to be rather chillier than it is, but he then went on to suggest that the air might absorb heat rising from the Earth’s surface, preventing it from escaping into space, thus warming the planet. This idea was inspired by earlier experiments carried out by Horace Bénédicte de Saussure, and so Fourier was the first person to describe “the greenhouse effect” (although he didn’t use that term).
The Greenhouse Effect
A quick physics refresher here: All light, be it visible, infrared, ultraviolet, radio, microwave, x-ray or gamma is the same stuff – electromagnetic radiation. The different categories are to do with the wavelength of the light. Wavelength is sort of the inverse of Frequency. The higher the frequency, the higher the energy of the light (and the shorter the wavelength). Talk of wavelength and frequency suggest something is waving, and indeed it is, for light has both magnetic and electrical field components, which are the things that are waving about. When one wiggles it generates the other and vice versa. End of physics lesson.
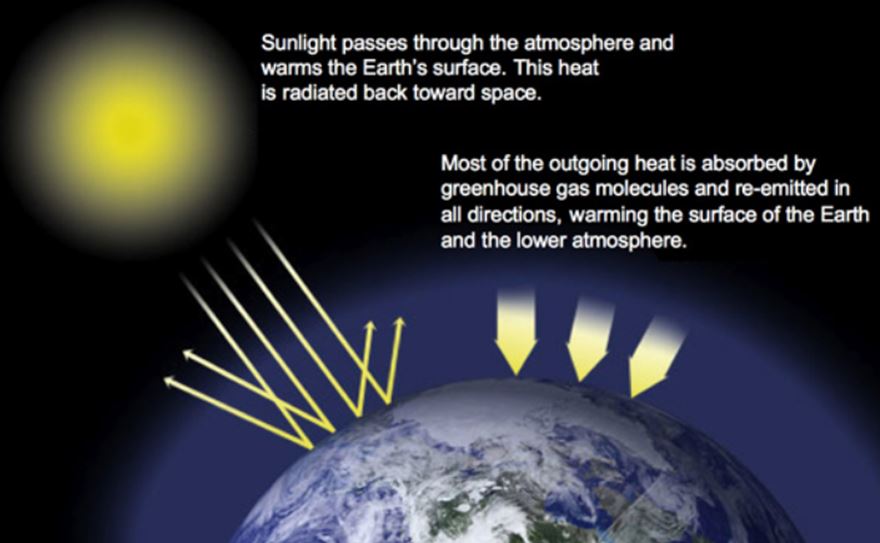
The greenhouse effect goes like this: The electromagnetic radiation reaching the Earth from the Sun consists mainly of visible and ultraviolet wavelengths. Not all of it reaches the ground, some is reflected back into space before that, but the planet absorbs the energy that does reach the surface and then reradiates it as infrared radiation. You can’t see infrared light with your eyes, but you can feel it on your skin – it’s what we call heat. On the way back up, greenhouse gases absorb the infrared light and reemit it in all directions. Some of it eventually escapes back into space; some goes back down towards the Earth’s surface. The result is a warming in the lower part of the atmosphere – think of it like putting a blanket on at night to keep warm.
The picture below is taken from NASA’s website here
Being just a little bit of a pedant about these things, the term “greenhouse effect” is not a bad one, but a glass greenhouse does not keep the air inside it warm for quite the same reason as the so-called greenhouse gasses (GHGs) do, and that’s because the infrared radiation in a greenhouse is trapped by the fact that glass is opaque to infrared radiation (and won’t let it back out), rather than the absorption/re-emission process described above.
GHGs vs. Non GHGs
Before discussing the gases that do contribute to global warming, let’s first look at the other gases that are present in the atmosphere that don’t. This is quite instructive for a couple of reasons which will become apparent.
The air we breathe is mostly made up of Nitrogen (78%), Oxygen (21%) and Argon (0.93%). The rest of the components of (dry) air are present in trace amounts as we will see when we look at GHGs.
Why is it that some molecules are affected by infrared radiation yet others aren’t? Well, it’s complicated, but Nitrogen and Oxygen exist in the atmosphere as N2 and O2 which are known as diatomic molecules (two atoms in the molecule). Argon exists as a monatomic molecule. When these molecules vibrate, there is very little change in the distribution of their electrons and hence very little change in the electrical charge distribution around the molecule. This makes them almost totally unaffected by infrared (IR) radiation – in other words, IR radiation is just not in tune with them; not on their wavelength so to speak.
There are several gases in the air that do contribute to global warming. Before discussing them individually, let’s just explain how it is that these GHG molecules are affected by IR radiation. If you can, imagine a molecule of Carbon Dioxide (CO2) which has one atom of Carbon bound to two atoms of Oxygen. When this molecule is excited by an incoming infrared photon of light, it vibrates and absorbs the photon, and then reemits another photon of IR in a different direction. It just so happens that the frequency that the molecule ‘likes’ to vibrate at is ‘in tune’ with the frequency of infrared radiation; and this is why the IR photons get absorbed. Photons of visible or ultraviolet light, for example, do not cause the molecule to ‘ring’ and are ignored.
A diagram is worth a thousand words and the following animation of a CO2 molecule being excited by a photon of IR radiation is from the UCAR website here

Human-caused climate change deniers (henceforth referred go as ‘deniers’) like to point out how small the contribution of GHGs like CO2 is to the overall makeup of the atmosphere; we just learnt that they are only present in trace amounts (just over 400 ppmv or 0.04% in the case of CO2). They ask “how could such small traces make any difference to the temperature of the Earth?” There are several answers to this, and one is that the greenhouse effect cannot be diluted by the non-GHGs. In other words doubling or halving the percentage of Nitrogen or Oxygen will not have any effect of the ability of the GHGs to absorb and reemit IR radiation. Additionally just because the GHGs are present in trace amounts, and people find it hard to believe they can be dangerous is not a very scientific way of going about things as there are lots of examples of things that humans have trouble imagining that are nonetheless true. For example even 0.000001% of Arsenic in the water supply is considered a danger to Human health.
The Greenhouse Gases
- Water vapour (H2O) is the most abundant greenhouse gas and is the biggest contributor to the ‘natural’ greenhouse effect. The amount present in the air varies depending on how ‘wet’ the air is. Water vapour provides us with an example of a bad ‘positive feedback’ in the climate meaning that more of it causes more warming which in turn causes more water vapour to form and so on. Human activity has little direct effect on the abundance of water vapour aside from the fact that warming caused by CO2 emissions causes warming, which causes more moisture, which causes more warming…
- Carbon Dioxide (CO2) is probably the most important of the GHGs. It has a much longer lifetime in the atmosphere and this can be anything between 30 and just below 100 years (By comparison, water vapour molecules hang around for about 9 days on average). We know for certain that human activities are increasing the amount of CO2 in the atmosphere.
- Methane (CH4) exists in quantities in the air about 200 times lower than CO2. The thing about methane is that it is a more ‘potent’ GHG than CO2 as it has a higher greenhouse ‘potential’. However, it has a shorter lifetime in the air than CO2 at about 11 years. Methane is currently responsible for about 20% of the non-natural greenhouse effect. It comes from sources such as cattle and drilling for natural gas. Recently there was a huge leak of methane in California which we really could have done without! A big worry with methane is another (bad) positive feedback effect where recent warming is melting the not-so-permafrost in places such as Eastern Siberia, this is venting methane which causes more warming which cause more venting…
- The are other GHGs including Nitrous Oxide, Ozone and CFCs, but their impact is not so important as those described above.
The Evidence
To be honest, when I write this stuff, I get to the point where I think that anyone reading this would already be convinced by the story so far. But I’ve only really introduced the science and haven’t presented any evidence of warming or that it is caused by GHGs. Let’s start by thinking about some experiments we could carry out to prove our case.
The first experiment I can think of is some way of looking down at the Earth from space and measuring the amount of radiation that is coming back from the surface. If we could measure the amount at the different wavelengths of light then that would be great. Secondly, it seems sensible to propose that, if the warming is being caused by GHGs in the lower part of the atmosphere, then if we could measure changes in temperature vertically through the atmosphere that would also prove valuable evidence. It turns out, of course, that we can do both these things.
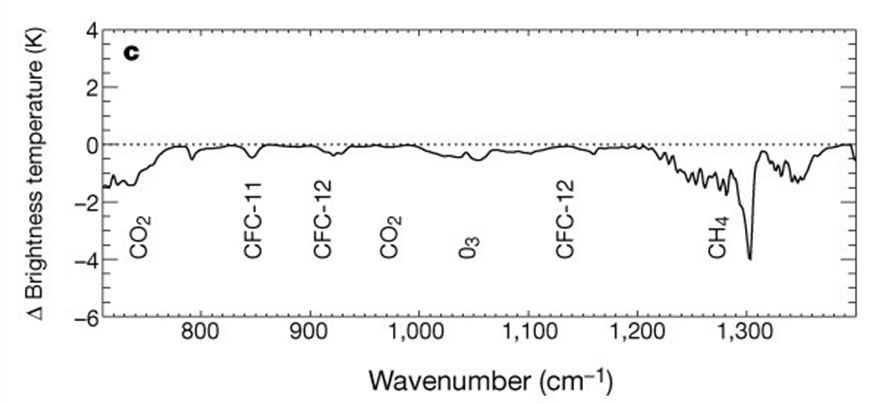
The first experiment has been carried out by satellites orbiting the Earth since 1970. They have been measuring the brightness of the radiation coming back up from the surface at various wavelengths. The chart below from a paper in published in Nature (Harries 2001) shows the change in the brightness over the infrared part of the electromagnetic spectrum from 1970 compared to 1997. This is a period over which the Earth has been measured to have warmed. The chart shows that the brightness decreases most at the IR wavelengths which are ‘tuned’ to the GHG molecules as described above. Here we can see the decrease due to Carbon Dioxide (CO2), Ozone (O3) and Methane (CH4), plus some other CFC molecules. In a nutshell, the Earth has got slightly dimmer over time in the IR wavelengths as seen from above, because more GHG molecules have held the IR ‘captive’.
The second experiment involves measuring the temperature changes over time at varying heights in the atmosphere. Some useful terminology here: The troposphere is the name for the lower region of the atmosphere covering from ground level up to roughly 18 km. The stratosphere takes over after that and goes on up to about 50 km in altitude (the mesosphere takes over higher than that).
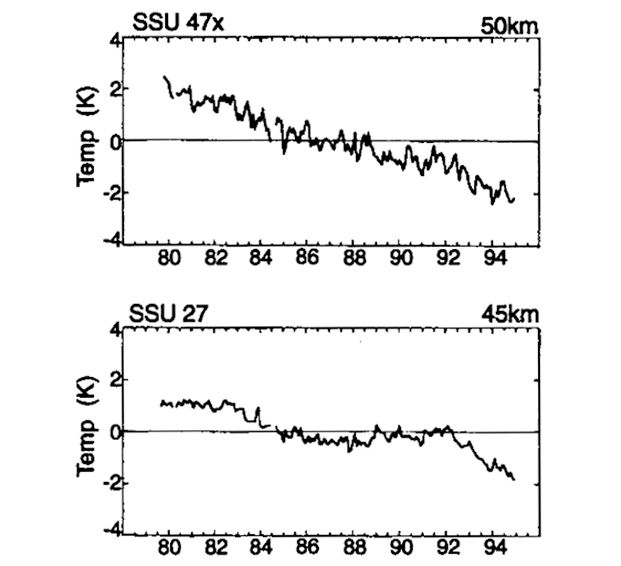
We can easily measure that GHGs are warming the troposphere. We use ground based weather stations and satellites. If the GHGs are preventing some of the IR radiation from leaving the troposphere we would also expect the upper atmosphere to cool over time as the lower atmosphere warms over time. Interestingly, the situation would be reversed if it was the Sun causing the warming.
Fortunately, since 1979 The National Oceanic and Atmospheric Administration (NOAA) have been operating the Stratospheric Sounding Units (SSUs). These satellites have provided near global stratospheric temperature data above the lower stratosphere. These meaurements clearly show that the stratosphere has been cooling whilst the troposphere has been warming. The chart below is taken from a study by Ramaswamy et al., Reviews of Geophysics, Feb. 2001. The data covers the time perion of 1980 to 1995.
There really is no other convincing way of explaining a cooling in the upper atmosphere whilst the lower atmosphere and surface warms.
Just one more thing. Satellite measurements have detected that the stratosphere is shrinking, this is exactly what you would expect as contraction occurs with cooling.
Case closed.


